Datenquellen
Jede Zahl auf dieser Website stammt aus einer genannten Datenquelle oder wird daraus berechnet. Diese Seite führt sie mit Lizenzen und Quellenangaben auf. Sie wird aus denselben Einträgen erzeugt, die der Build verwendet, und passt daher immer zu dem, was die Website ausliefert.
Datensätze
| Quelle | Verwendet für | Lizenz |
|---|---|---|
| Natural Earth Natural Earth, v5.1.2 | Ländergrenzen, Umrisse und Beschriftungspunkte für den Globus und die Karten. | Gemeinfrei |
| International Migrant Stock 2024 United Nations, Department of Economic and Social Affairs, Population Division, 2024 | Wie viele Menschen außerhalb ihres Geburtslandes leben, nach Ziel- und Herkunftsland, von 1990 bis 2024. | CC BY 3.0 IGO |
| World Population Prospects 2024 United Nations, Department of Economic and Social Affairs, Population Division, 2024 | Bevölkerung nach Alter und Geschlecht, Geburten, Sterbefälle, Lebenserwartung und Migration für jedes Land und die Welt, 1950 bis 2100. Schätzungen bis 2023, Projektionen ab 2024. | CC BY 3.0 IGO |
| World Population Prospects 2024: life tables United Nations, Department of Economic and Social Affairs, Population Division, 2024 | Periodensterbetafeln für jedes Land und Gebiet, 1950 bis 2100: Lebenserwartung und Überlebende in jedem Alter, nach Geschlecht. | CC BY 3.0 IGO |
| World Population Prospects 2024: projection variants and intervals United Nations, Department of Economic and Social Affairs, Population Division, 2024 | Alternative UN-Projektionen der Gesamtbevölkerung bis 2100: deterministische Varianten und die probabilistischen Vorhersageintervalle. | CC BY 3.0 IGO |
| World Urbanization Prospects 2025 United Nations, Department of Economic and Social Affairs, Population Division, 2025 | Der Anteil der Bevölkerung jedes Landes, der in Städten, in Kleinstädten und halbdichten Gebieten und in ländlichen Gebieten lebt, von 1950 bis 2050. | CC BY 3.0 IGO |
| World Urbanization Prospects 2025: cities United Nations, Department of Economic and Social Affairs, Population Division, 2025 | Die Bevölkerung jeder Stadt mit 50.000 oder mehr Menschen, in jedem Land gleich abgegrenzt, von 1975 bis 2050. | CC BY 3.0 IGO |
| Human Development Report, composite indices time series United Nations Development Programme, Human Development Report Office, 2025 | Der Index der menschlichen Entwicklung nach Ländern, eine Zusammenfassung von Gesundheit, Bildung und Einkommen, für Vergleiche über die Zeit. | CC BY 3.0 IGO |
| State population estimates by single year of age and sex (Vintage 2025, Vintage 2020) US Census Bureau, Population Division, 2026-06-25 | The population of each US state and the District of Columbia by single year of age and sex on 1 July, 2010 to 2025, for the US states pages and the state choice in Your life and the age tools. | Public domain (US Government work) |
| World Development Indicators World Bank, 2026-10-08 | Internetnutzung, Zugang zu Elektrizität und Alphabetisierung nach Ländern, für Vergleiche der Welt über ein Leben hinweg. | CC BY 4.0 |
Software und Schriften
| Quelle | Verwendet für | Lizenz |
|---|---|---|
| three.js | 3D-Ansichten | MIT |
| Inter | Schrift | SIL OFL 1.1 |
| Unicode CLDR | Ländernamen | Unicode License v3 |
Fotos
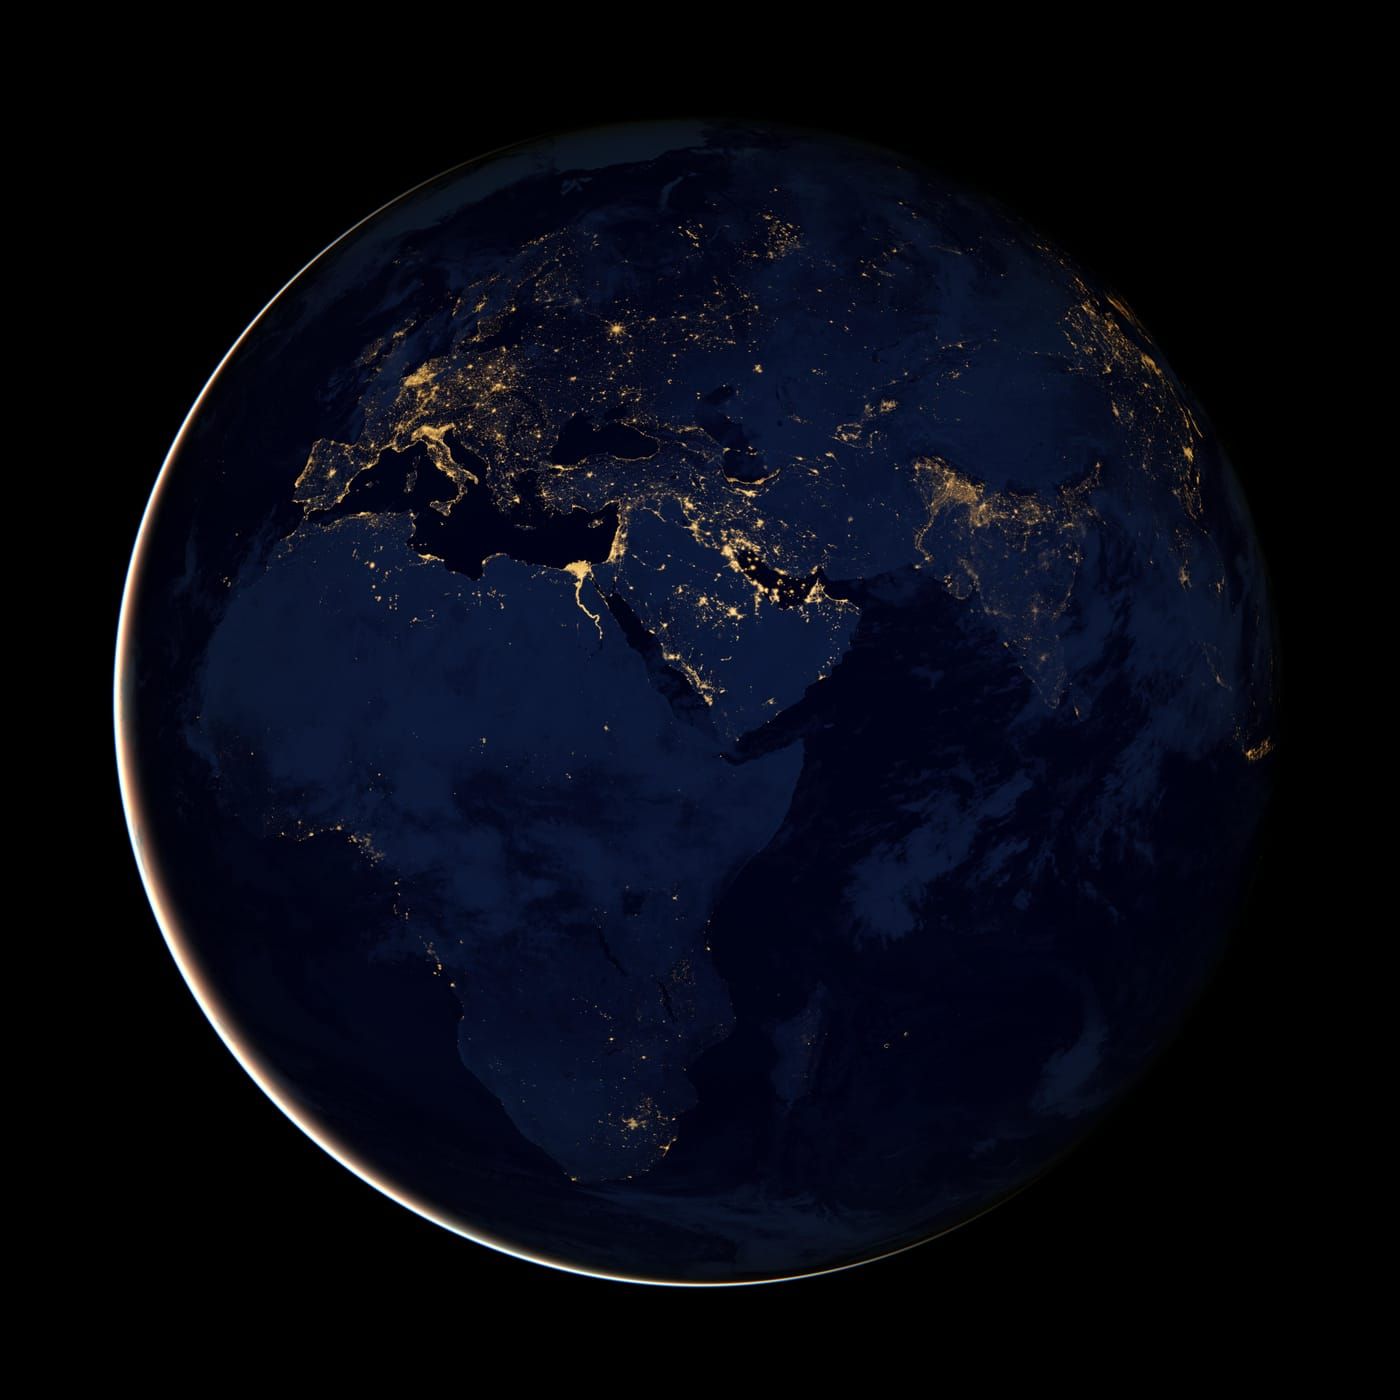
Die Kopffotos mit ihren Quellen. Stadtlichter zeigen, wo nachts Licht ist, nicht wie viele Menschen dort leben. Keine Zahl auf der Website stammt aus ihnen.
Flags
The flags beside country names come from the open-source collection flag-icons, Panayiotis Lipiridis, MIT.