Generation landscape
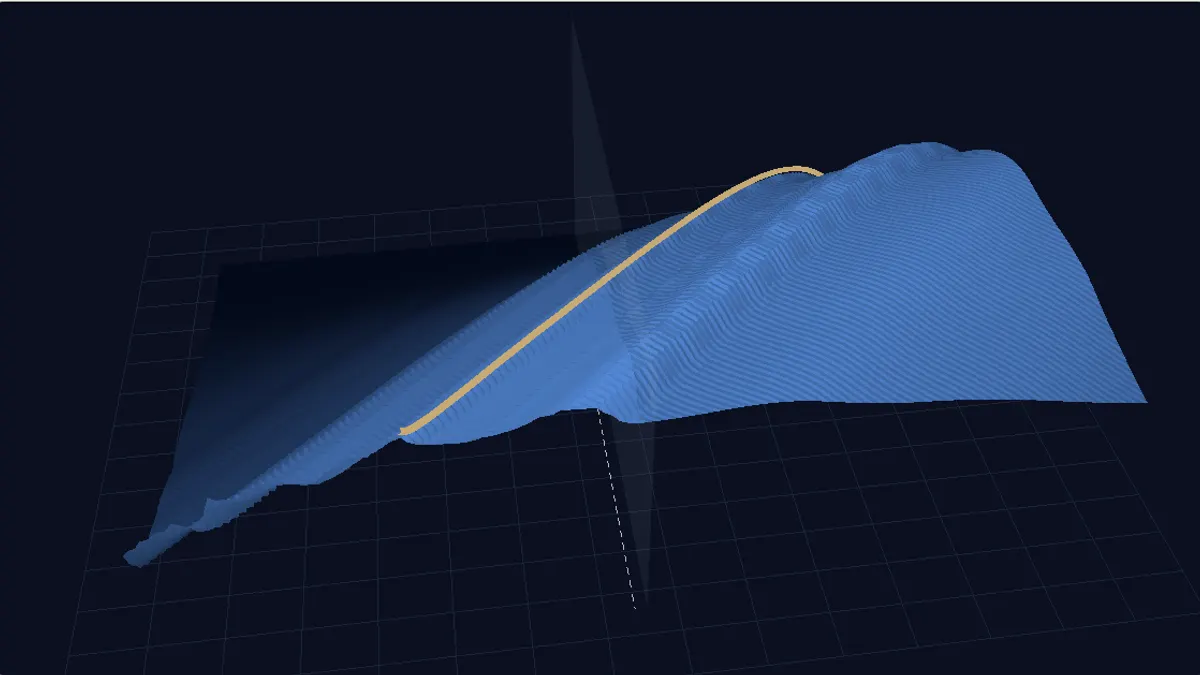
The population of the world, or any country, as a landscape of every age in every year. Your generation runs across it as a ribbon.
The largest group of people of one age in the UN data, 1950 to 2100: 142 million people aged 0 on 1 January 2013.
UN World Population Prospects 2024. Years from 2024 on are projections.
See the numbers
| Year | Age | People |
|---|---|---|
| 1961 | 0 | 92,879,781 |
| 1970 | 9 | 81,552,488 |
| 1980 | 19 | 79,662,445 |
| 1990 | 29 | 78,058,354 |
| 2000 | 39 | 75,941,751 |
| 2010 | 49 | 72,479,757 |
| 2020 | 59 | 67,034,203 |
| 2030 | 69 | 56,899,263 |
| 2040 | 79 | 40,912,492 |
| 2050 | 89 | 18,428,756 |
1 January 2026 Projection
UN projection, medium variant · UN World Population Prospects 2024
Only the year is needed. It stays in this browser.
How to use this tool
- 1Enter your birth year: your cohort appears as an amber ribbon. Add a second cohort to compare.
- 2Move the year to cut out that year’s ages, shown as a pyramid below. Choose an age to follow it through time.
- 3Press "Follow my generation" to move along your cohort, year by year.
How it works
The surface has one point for every age from 0 to 100 and every year from 1950 to 2100: its height is the number of people of that age on 1 January of that year, or their share of that year’s population. All values come from the UN World Population Prospects 2024, projections from 2024 on, which are hatched.
A birth cohort moves one age up every year, so it runs diagonally across the surface. On 1 January, the people of age a were born, to within a day, in the year a + 1 before.
The last age, 100, is the UN’s open group of 100 and over. The tables below the view list the same numbers as the surface, for every age of the chosen year.
Frequently asked questions
Why does my generation’s ribbon go down over time?
A cohort only loses people, through deaths, unless more people move in than leave. The ribbon’s height is the number still alive.
What are the ridges running across the surface?
A ridge along the diagonal is a large birth cohort moving up through the ages, a valley a small one. Changes in births leave these marks for a lifetime.