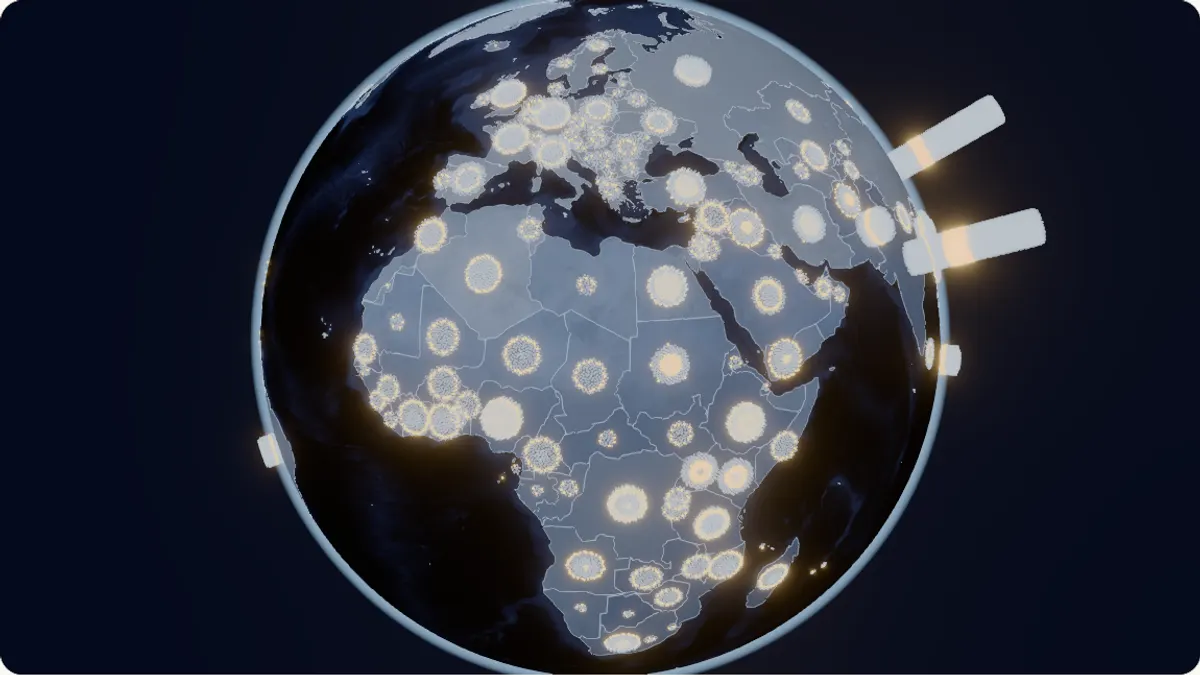
City globe
Every city of 50,000 people or more on one globe, from 1975 to the UN projection for 2050. Find a city, see how it grew and compare it with another.
Cities of a million people or more: 165 in 1975, 511 in 2025 and, by the UN projection, 611 in 2050.
UN World Urbanization Prospects 2025, cities by the degree of urbanisation.
 JakartaIndonesia41.9M
 DhakaBangladesh36.6M
 Tōkyō (Tokyo)Japan33.4M
 New DelhiIndia30.2M
 ShanghaiChina29.6M
- GuangzhouChina27.6M
 Al-Qahirah (Cairo)Egypt25.6M
 ManilaPhilippines24.7M
- KolkataIndia22.5M
 SeoulSouth Korea22.5M
See the numbers
| City | Country | Population |
|---|---|---|
| Jakarta | Indonesia | 41,913,860 |
| Dhaka | Bangladesh | 36,585,479 |
| Tōkyō (Tokyo) | Japan | 33,412,512 |
| New Delhi | India | 30,222,405 |
| Shanghai | China | 29,558,908 |
| Guangzhou | China | 27,563,372 |
| Al-Qahirah (Cairo) | Egypt | 25,566,102 |
| Manila | Philippines | 24,735,305 |
| Kolkata | India | 22,549,738 |
| Seoul | South Korea | 22,490,482 |
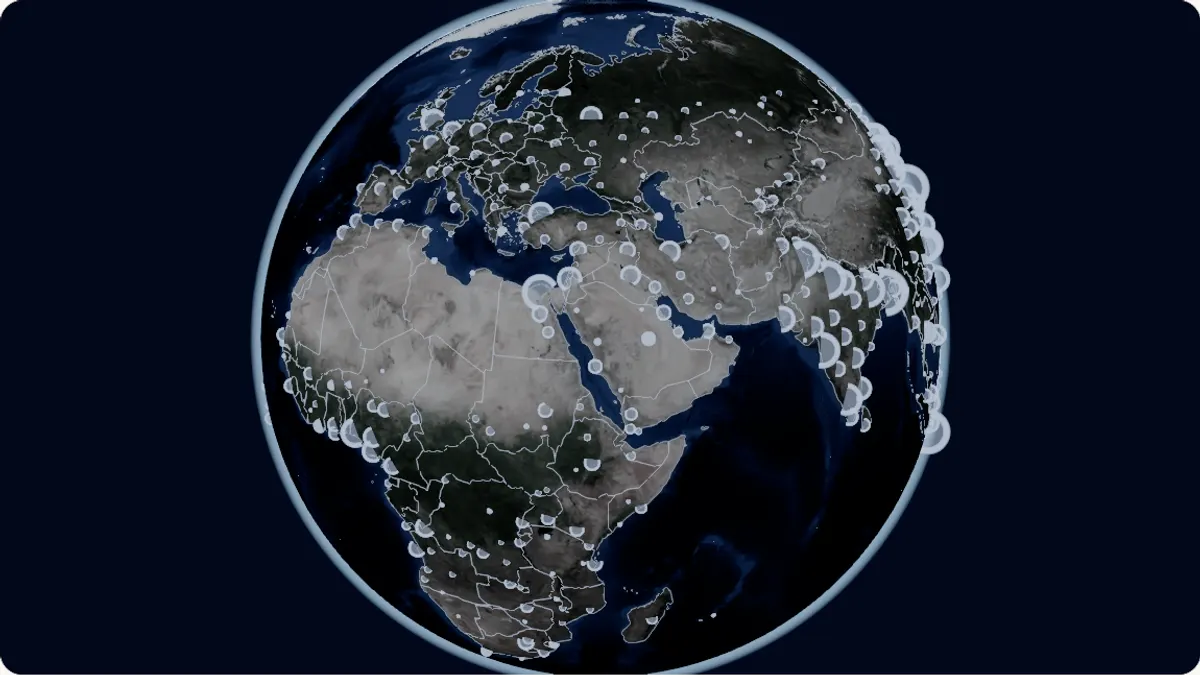
How to use this tool
- 1Drag to turn the globe, scroll or pinch to zoom. Rings are groups of nearby cities that open as you come closer.
- 2Find a city or tap one to see its population, its share of the country and its timeline.
- 3Move the year, show only larger cities, or compare two cities side by side.
How it works
A city here is a dense area of at least 1,500 people per km² with at least 50,000 people, drawn on a population grid by the UN degree of urbanisation. The same rule applies in every country, so cities can be compared, but a city can differ from its administrative borders.
The globe shows every fifth year from 1975 to 2050. Years from 2026 on are UN projections. A city’s timeline has every year.
The area of a disc grows with the number of people. From afar, nearby cities are grouped into rings with their total, so no one is left out at any zoom.
Shares divide a city’s population on 1 July by its country’s, from World Population Prospects 2024.
Frequently asked questions
Why is my city smaller or larger than in national statistics?
The UN draws every city by the same density rule on a population grid. National figures often use administrative borders, which can leave out suburbs or include rural land.
Why are some well-known cities missing?
Where several cities have grown into one dense area, the UN counts them as one city, under one name.
Why are some cities missing in early years?
A place appears once it has 50,000 people or more. Before that it is shown as under 50,000, never as zero.